Land, Water and Cities
Mapping Asian Floods From Orbit
When monsoon rivers rise, radar satellites see through cloud and map the water. How flood extent maps are built and used, from relief to river basin planning.
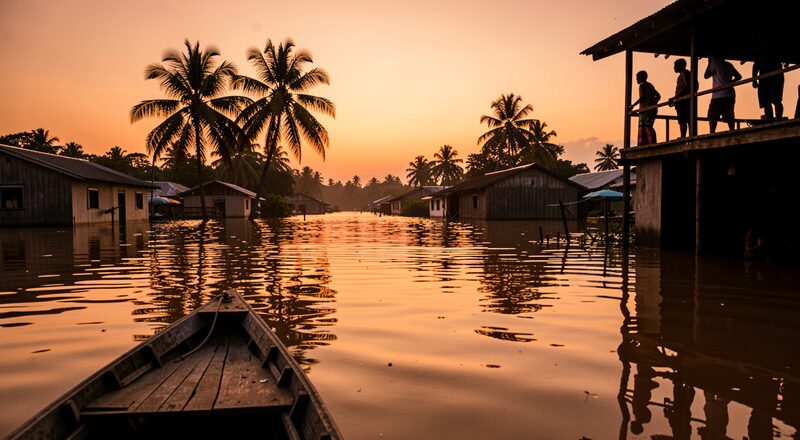
When a monsoon flood cuts roads and knocks out phone networks, the oldest reliable witness left standing is a radar satellite several hundred kilometres overhead. Floods are the disaster that Asian remote sensing knows best: the water is easy to see from orbit, the events recur every season, and the maps genuinely change what happens on the ground. This guide follows the practice from sensor to delivered map, and explains why radar, the harder-looking image, is the easier tool for this job.
Why floods defeat ordinary cameras
The difficulty is structural. Flooding in South and Southeast Asia arrives under the very clouds that cause it, so optical satellites, which need reflected sunlight, return picture after picture of the storm top rather than the water below. By the time skies clear, the peak has often passed and the flood has started draining, leaving the largest extent unrecorded. Radar sidesteps the problem entirely: the satellite sends its own microwave pulse downward and records the echo, so night is irrelevant and cloud is nearly transparent. The trade is that radar images read as strange, speckled grey scenes that take training to interpret, a trade most flood teams happily accept.
What a radar satellite sees in standing water
The signature is simple physics. A radar pulse that hits rough ground scatters back in many directions, and some of that scatter returns to the antenna, so dry land prints mid-grey to bright. A pulse that hits a smooth water surface reflects away from the satellite like light off a mirror, so almost nothing returns, and open water prints near-black. A flooded field therefore appears as a dark patch exactly where the crop or soil used to be bright. The rule has limits: wind ruffles a water surface and brightens it, tall vegetation poking through shallow flood scatters the pulse back, and radar shadow on steep slopes can imitate water. Each limit is managed with checks described later, but none overturns the central behaviour. Flood mapping from radar is, at heart, the careful labelling of dark areas.
The satellites that do the work
The workhorse is Sentinel-1, the European radar pair whose C-band data is free, covers all of Asia, and revisits each location every six to twelve days depending on latitude and which of the two spacecraft is overhead. Because the revisit is a matter of days, a flood is usually captured at least once near its peak, and often twice, rising then falling. Around the free fleet sit the national radars surveyed in the guide to Asia's own Earth observation satellites: Japan's ALOS-2, whose longer L-band wavelength holds signal over flooded vegetation, and India's RISAT series, exercised during cyclone and flood response. Commercial radar can be tasked for a specific basin on a specific night when the stakes justify the order, but the free stream has made that the exception rather than the rule.
From scene to water mask
The production chain is short enough to describe in one paragraph. The team downloads one radar scene from before the flood and one or more from during it. The images are terrain-corrected and filtered to calm the speckle, then compared: pixels that were mid-grey and went black between the two dates are marked as newly flooded. The change-detection approach matters because permanent dark features, calm rivers, reservoirs, aquaculture ponds, would otherwise be counted every time. The result is a water mask, a layer outlining flooded area at the moment of the second scene, which is overlaid on population and road data to answer the questions that actually get asked: which villages, which roads, which health facilities. The steps run in standard desktop software or in the cloud platforms compared in the guide to Google Earth Engine and QGIS, and the whole chain, from satellite pass to delivered map, fits inside a working day for an experienced team.
Who uses the maps, and when
During the event, the maps feed disaster coordination: relief agencies use extent layers to plan boat routes and supply drops where road networks are drowned, and provincial offices use them to order evacuations district by district rather than blind. In the weeks after, the same masks drive damage assessment for agriculture and housing, since a paddy recorded as flooded during the grain-filling stage is a paddy with a known yield loss. In the years after, the accumulated record of many floods becomes the evidence base for embankment planning and, increasingly, for the risk maps that decide where rebuilding is discouraged. The United Nations UN-SPIDER platform gathers exactly this kind of space-derived disaster product, and its archive of Asian flood activations shows the practice at national and international scale.
What the radar cannot say
Honesty about limits is what keeps these maps trusted. Radar sees surface water, not depth: a flooded paddy ten centimetres deep and a drowned district under two metres of river print identically black. Interpreters combine the mask with topography to infer depth, an estimate, not a measurement. The revisit gap means a fast flash flood in a small catchment can rise and fall entirely between two satellite passes, and for those events the ten-minute storm loop of Himawari provides context rather than extent. Under dense canopy or inside cities, radar behaviour grows complicated enough that confident statements need supporting evidence. Every published map should therefore carry its scene dates and its known blind spots, and the strongest ones are checked against the field discipline described in the guide to ground truth.
Where the practice is heading
Three shifts are visible in recent seasons. Machine learning classifiers are replacing hand-tuned darkness thresholds, and catching flooded vegetation the simple rules missed. Rapid mapping services now publish preliminary masks within hours of a pass, fast enough to matter during the event rather than after it. And the growing radar constellation population is tightening revisit, pushing the six-to-twelve-day gap toward the point where even flash floods are caught. None of these shifts changes the underlying craft, which remains the patient pairing of dark pixels with ground reality, season after season, in the basins introduced in the section on land, water and cities.